Distributed tracing
OTLP-native ingest. Spans, baggage, and propagation work with first-party Node, Go, and Rust SDKs — and any OpenTelemetry SDK over OTLP.
Open source · MIT licensed
Debug AI agents, and help AI agents debug software. Observability Unified turns traces, logs, replay, AI cost, profiles, agent actions, tool calls, evals, and instrumentation gaps into one evidence graph. The evidence retrieval layer applies CCR — compressed context retrieval — so agents start with compact bundles, citations, confidence, compaction provenance, and explicit refs they can expand only when needed. Start locally with one Docker image. For production, choose Cloudflare Workers with D1/R2, or run the Node collector on any cloud with Postgres and S3-compatible storage.
Identity propagated end-to-end:
user_id → session_id → interaction_id → trace_id → span_id → action_id
The interaction ID follows a frontend action into backend spans, logs, AI calls, actions, evals, and MCP tools; CPU/off-CPU profiles join through the trace it caused.
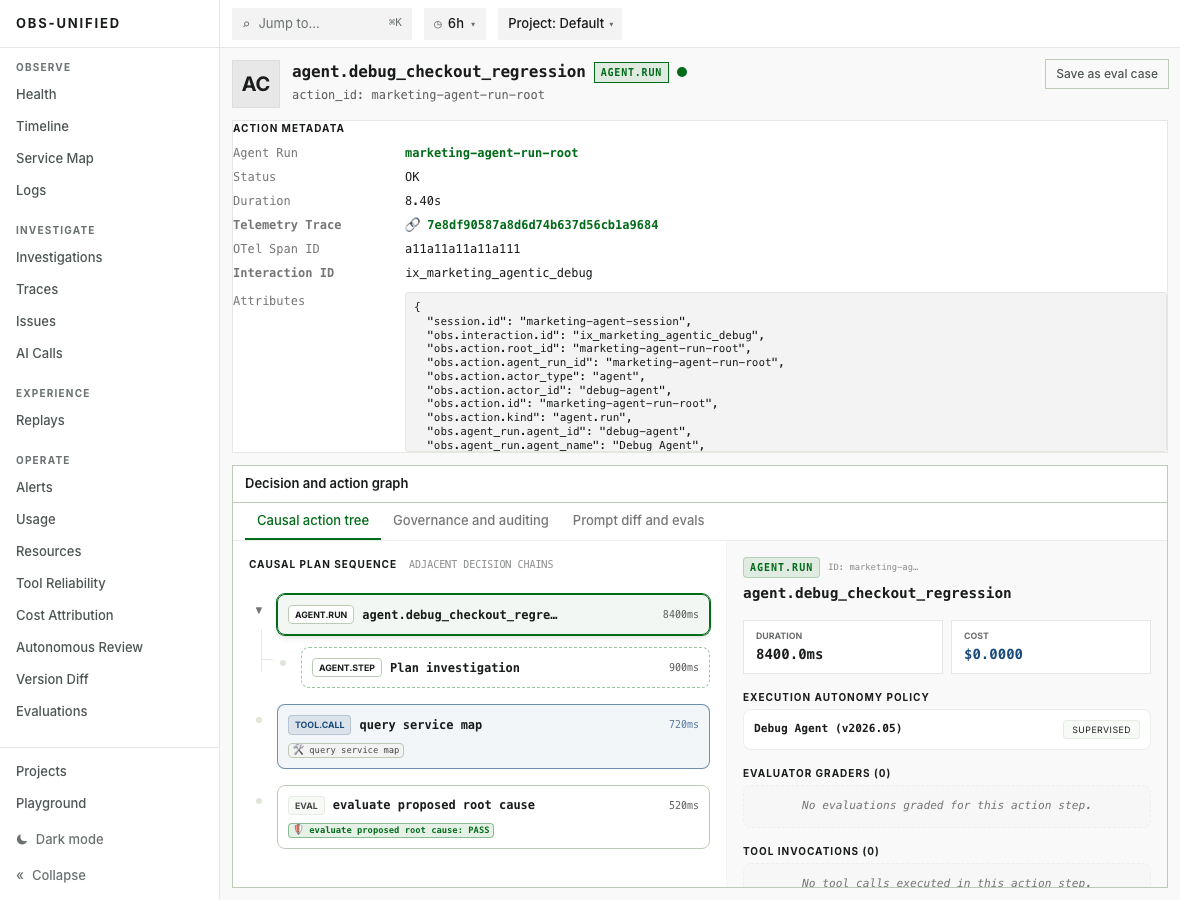
See what an agent did, what each step caused, which evidence is explicit or inferred, and which trace, log, replay, AI cost, tool, eval, or profile explains the result.
Product proof
Captured from the OpenTelemetry Astronomy Shop flowing through Observability Unified, including the Agent Action Graph, interaction ID path, connected trace evidence, AI cost, and profile join point.
The agent run, plan, tool calls, evals, trace ID, and interaction ID are visible in one causal view.

The same interaction_id follows a frontend action into backend traces, logs, replay, AI spans, and profiles.
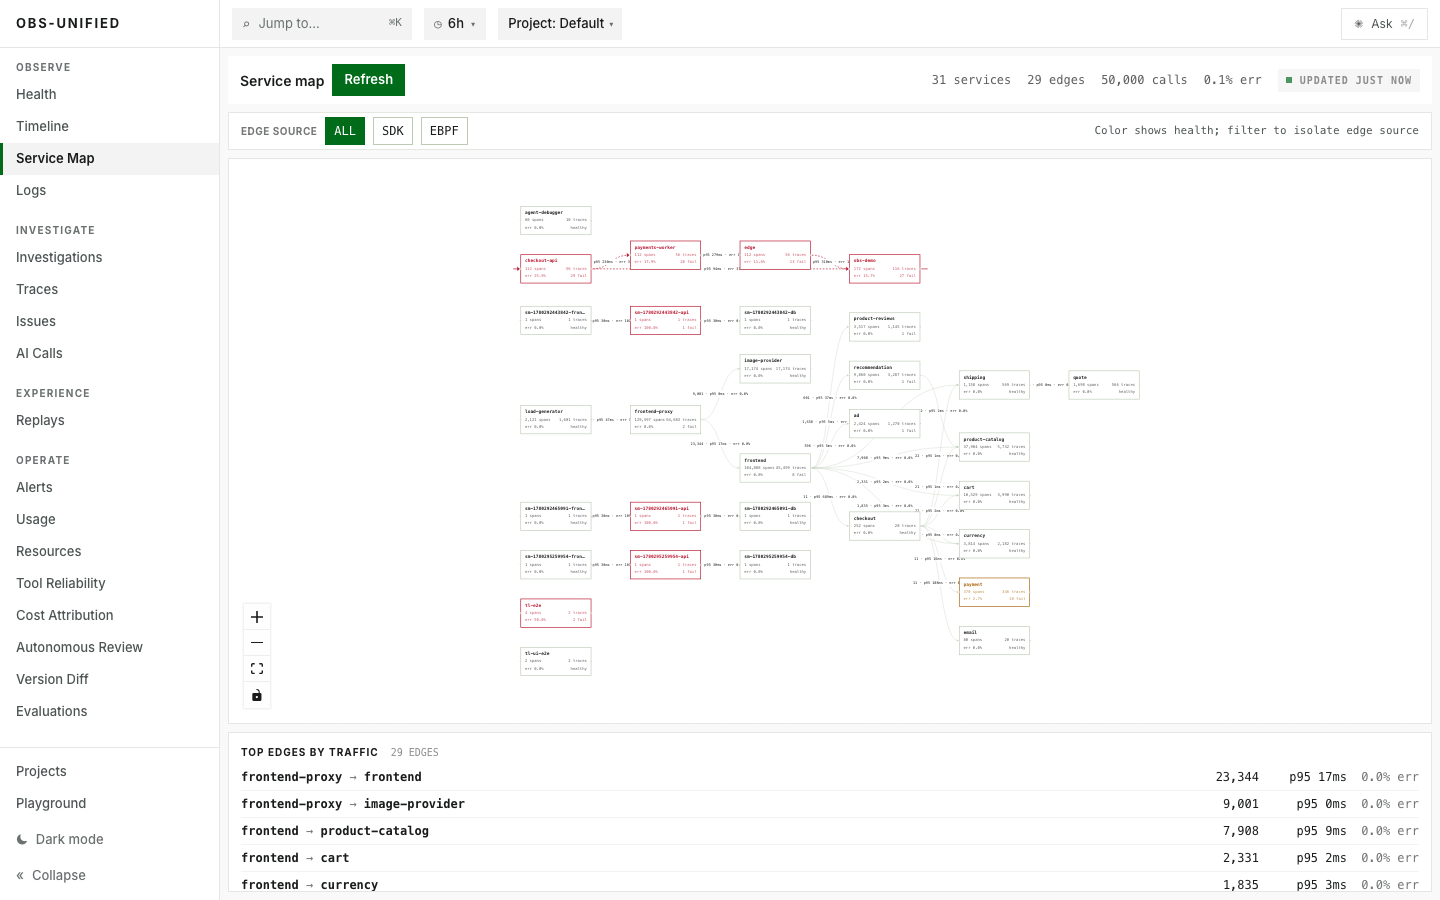
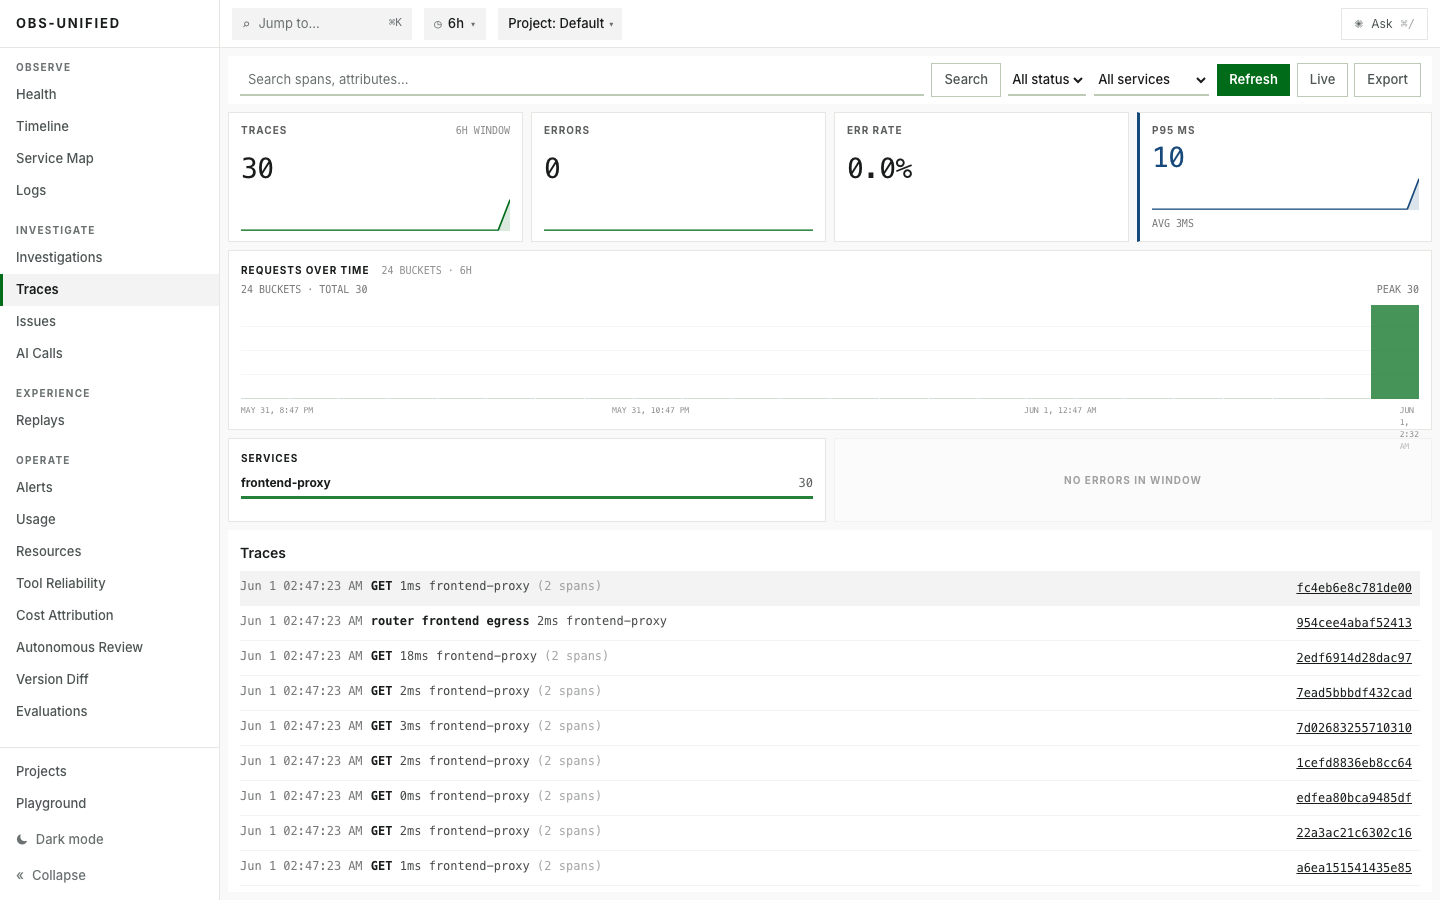
Real demo traffic across 21 services, edge volume, latency, and errors.
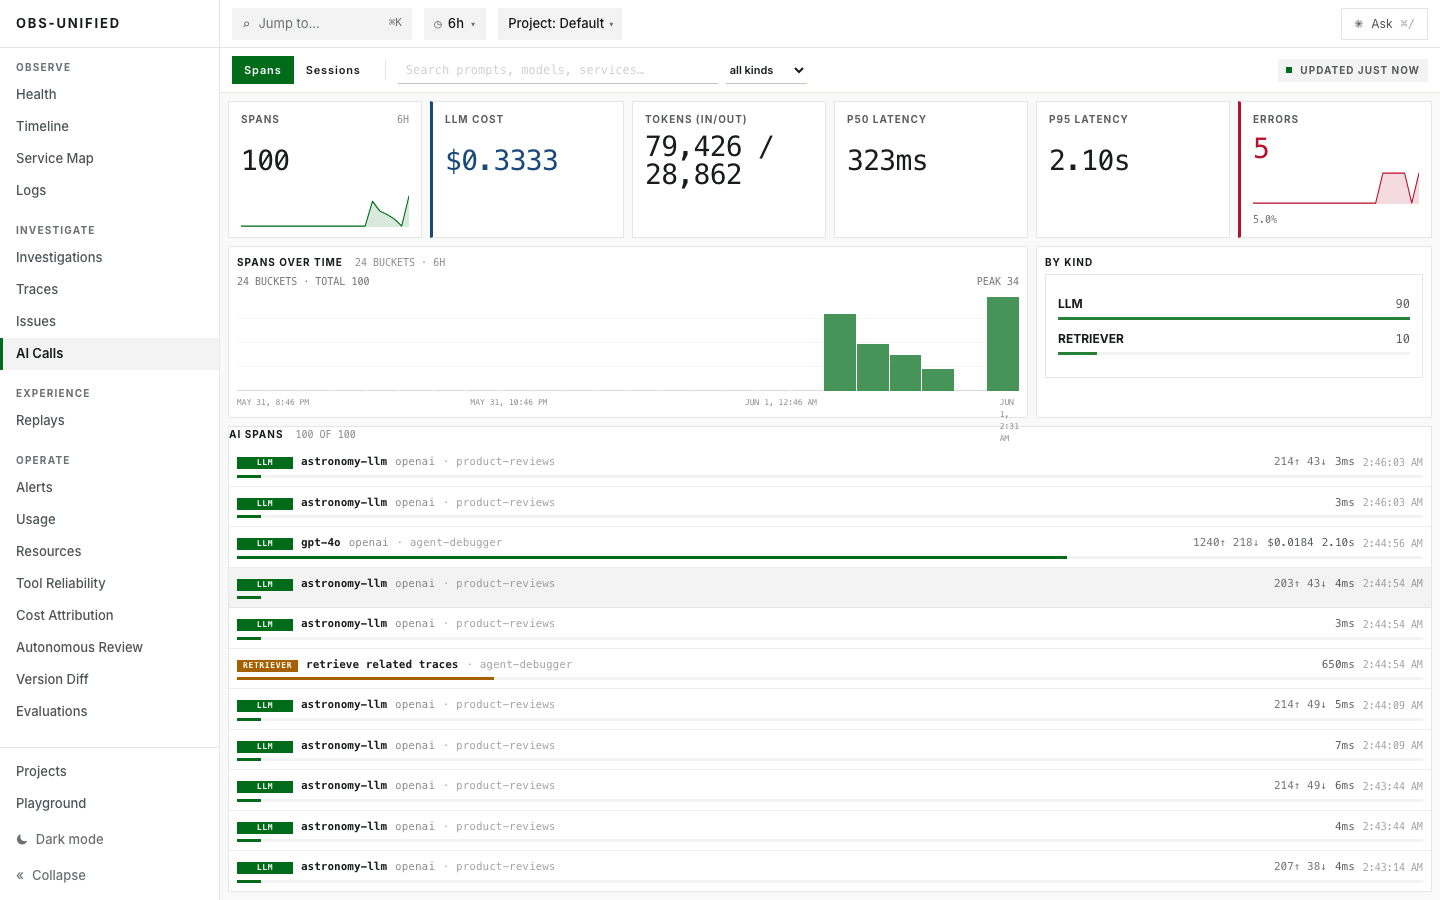
Model, token, cost, latency, and error signals stay queryable together.
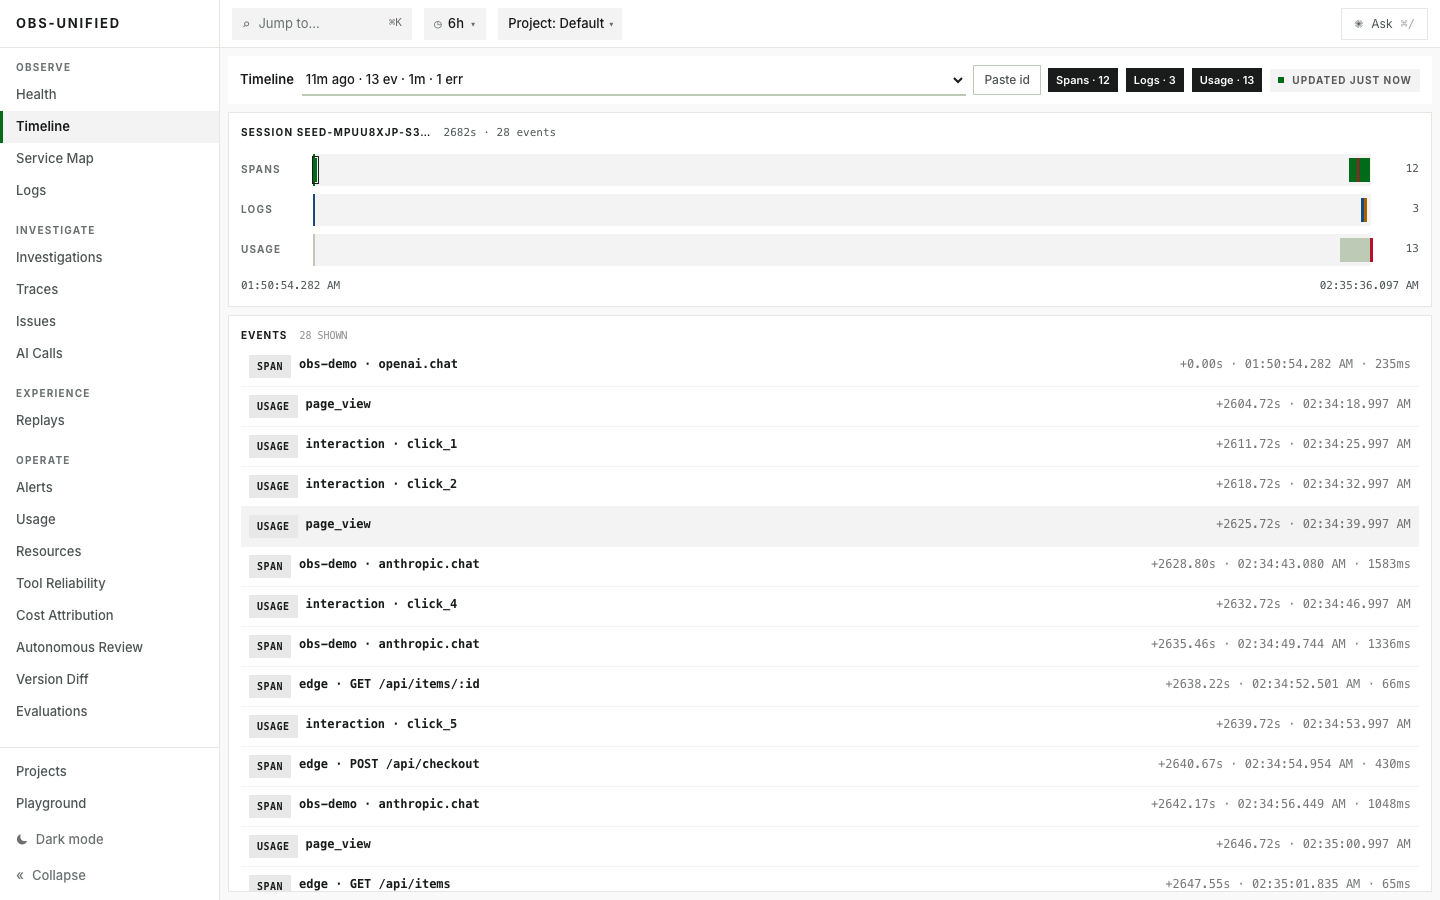
User, trace, log, replay, and usage events line up in one incident story.
Trace detail keeps the profile join point visible so agents can carry a root-cause path down to CPU evidence.
One collector · one identity chain · dashboard + MCP
Observability Unified replaces the patchwork of APM + logging + product analytics + session replay + LLM observability + alerting with one unified stack, correlated through a single identity chain and explorable through the dashboard, action graph, structured evidence references, or MCP tools.
OTLP-native ingest. Spans, baggage, and propagation work with first-party Node, Go, and Rust SDKs — and any OpenTelemetry SDK over OTLP.
JSON logs with severity, automatic trace correlation, and per-module loggers. Auto-attached to the active span — no copy-paste IDs.
LLM calls, retrievals, tool calls, agent runs, eval cases, tokens, USD cost, latency, and failure category — all linked into one causal action graph.
Evidence bundles compact repeated logs, rank spans, preserve citations, and return retrieval refs so agents can expand raw logs, profiles, replay, AI calls, or tool calls on demand.
Browser sessions recorded with rrweb, stored as DOM-mutation chunks in R2, and replayed inline next to the trace they belong to.
Page views, interactions, errors, UTM parameters, and identity stitching — the product-analytics layer, in the same store as your traces.
A click mints one interaction_id. Backend spans, logs, AI calls, action graphs, MCP tools, and CPU profiles join through the resulting trace.
Alert rules over any signal — latency, error rate, AI spend, custom usage events. One rules engine and one notification surface across the stack.
Identity linking from anonymous visitor to logged-in user, with traits and event history. Every signal can be filtered by user and replayed from their perspective.
First-party SDKs for TypeScript, Go, and Rust plus an MCP server that lets agents inspect traces, logs, replays, profiles, agent runs, actions, tools, and evals.
Evidence retrieval · CCR
CCR means compressed context retrieval: the collector clusters repetitive logs, selects exemplars, ranks failed spans and critical paths, correlates traces/actions/profiles/replay, and hands the agent explicit retrieval refs for deeper inspection. The agent still controls expansion; the platform just makes the first packet useful.
Without CCR, an agent tends to page through broad logs, full traces, profile metadata, replay metadata, and action records separately. Repeated messages like hundreds of identical 404s consume context even though one exemplar plus count is enough to start.
search_logs({ traceId, limit: 500 })
get_trace(traceId)
get_action(actionId)
get_profile(profileId)
get_replay(sessionId)With CCR, the agent asks for one compact bundle anchored on a trace, action, agent run, or tool call. The response includes summaries, evidence refs, compaction records, suggested pivots, and retrieval refs for raw data that remains available but explicit.
get_evidence_bundle({ anchor, targetTokens })
retrieve_evidence_ref(refId)
search_evidence_ref(refId, "checkout 404")
get_evidence_stats()
Benchmark recipe
Use fixed anchors, the same agent prompt, and the same token budget. In the off run, let the agent use raw tools such as log search and trace detail. In the on run, start with get_evidence_bundle and only expand retrieval refs the agent chooses. Compare token input, tool calls, raw rows read, cited evidence, and whether the same root cause is reached.
Executed benchmark
Local benchmark run on June 4, 2026 against the shipped evidence retrieval route. Scenario: a checkout trace with a failed payment span and 500 correlated 404 log rows. CCR preserved the failed payment span reference while reducing the first context packet.
Quick preview
Start the local stack, pick SDKs for your runtime, and initialize each service. Backend spans, frontend interactions, and AI spans share the same identity chain automatically.
Pull the all-in-one image from GHCR, or build the same image from a clone.
# Fastest first run
docker run --rm -p 5173:5173 -p 8790:8790 \
  ghcr.io/obs-unified/local:latest

# Editable local repo
git clone https://github.com/obs-unified/obs-unified.git
cd obs-unified
pnpm install
pnpm local:image
pnpm local:runRunnable examples and recipes live in Examples and SDK docs
Backend:
  TypeScript  @obs-unified/* on GitHub Packages
  Go          sdks/go
  Rust        sdks/rust

Browser:
React/vanilla @obs-unified/analytics-sdkShort path shown. Full TypeScript, Go, and Rust examples live in Getting started.
// Backend
initObservability({ serviceName: "checkout-api" });
const log = createLogger("checkout");
const llm = startLLMSpan("checkout.assistant");
log.info("charge.starting", { interaction_id });
llm.end();

// Frontend
trackInteraction("checkout_click");
Architecture
Instrumented services write telemetry into Observability Unified. Humans and agents read the same connected graph through dashboard APIs, compact evidence bundles, structured evidence references, and MCP tools, while ingest credentials stay separate from investigation access.
interactions, replay, errors
traces, logs, profiles
edge requests, jobs
agent runs, tokens, cost, tools
Write-only keys send telemetry without read access.
Normalizes every signal into one identity chain.
D1/R2 or Postgres/S3
evidence IDs, compact bundles, traces, logs, replay, AI cost, actions, CPU
Agents inspect telemetry with MCP investigation tools.
inspect sessions, traces, logs, replay, alerts, costs
follow compact bundles, refs, confidence, and pivots
follow evidence from action to root cause
How it compares — snapshot as of May 2026
Most teams glue an APM, a product-analytics tool, an error/session tool, and now an LLM-observability tool together. Observability Unified brings those workflows under one identity chain and one dashboard, so humans and agents can traverse from user action to backend trace, logs, replay, AI cost, and CPU profile while keeping the data plane in your infrastructure.
| Capability | Observability Unified | Datadog | Sentry | PostHog | Honeycomb | New Relic | Grafana Cloud | SigNoz | Uptrace | HyperDX |
|---|---|---|---|---|---|---|---|---|---|---|
| Hosting model | Self-host on your infra | SaaS only [1] | SaaS or Fair Source self-host [2] | Cloud-first · OSS self-host (hobby) [3] | SaaS · Private Cloud AWS [4] | SaaS only [5] | Cloud or self-host LGTM [6] | Cloud or OSS self-host [7] | Cloud or OSS self-host [8] | Cloud · OSS · ClickStack [9] |
| Pricing model | Free · pay your own infra | Per host + per signal [10] | Tier + per-unit overage [11] | Per-unit, per product [12] | Per event volume [13] | $/GB + per-user seat [14] | Per series + $/GB [15] | $0.30/GB ingest [16] | $0.10/GB ingest [17] | $20 flat + $0.40/GB [18] |
| Traces / APM | OTLP-native (HTTP) | Yes · OTLP in Preview [19] | Performance · OTLP beta [20] | LLM-scoped only [21] | OTLP-native [22] | Native OTLP [23] | Tempo · OTLP [24] | OTLP-native [25] | OTLP-native [26] | OTLP-native [27] |
| Structured logs | Trace-correlated | Yes [28] | Yes · trace-connected [29] | Yes (GA Jan 2026) [30] | Modeled as wide events [31] | Yes · Grok-parsed [32] | Loki [33] | Yes · Logs Explorer [34] | Yes [35] | Yes · ClickHouse-backed [36] |
| AI / LLM observability | Built-in | LLM Observability [37] | Agent Mon · Seer [38] | LLM Analytics [39] | Agent Obs (Early Access) [40] | AI Monitoring [41] | AI Observability (preview) [42] | LLM Observability [43] | — [44] | Via OpenLLMetry [45] |
| Session replay | rrweb | Yes (RUM) [46] | Yes (web + mobile) [47] | rrweb [48] | — [49] | Yes · DOM-based [50] | Yes · Frontend Obs [51] | — [52] | — [53] | Yes · auto-linked [54] |
| Product analytics | Yes | Yes [55] | — [56] | Flagship [57] | — [58] | Browser-only [59] | — [60] | — [61] | — [62] | — [63] |
| Alerts | All signals · one engine | Many · Watchdog ML [64] | Issues · uptime · crons [65] | On trends only [66] | Triggers · BubbleUp [67] | NRQL conditions [68] | Unified Alerting [69] | 5 alert types [70] | Metric + Error [71] | Search + chart-based [72] |
| Cross-signal pivots | One traversable graph | Within platform [73] | Within platform · trace-id [74] | Within event store [75] | Unified wide events [76] | Via NRQL [77] | Per-data-source plumbing [78] | Trace ↔ logs [79] | Within platform · UQL [80] | Auto-linked across signals [81] |
| Data ownership | Your D1/R2 or Postgres/S3 | Datadog cloud [1] | Sentry cloud or yours [2] | PostHog cloud or yours [3] | Honeycomb or your AWS [82] | New Relic US/EU [5] | Grafana cloud or yours [6] | SigNoz cloud or yours [83] | Uptrace cloud or yours [8] | Cloud (US) or yours [84] |
Numbered superscripts link to the underlying vendor source. Full methodology, vendor profiles, and quoted citations live in the comparison research doc (last reviewed 2026-05-31 · re-reviewed quarterly).
FAQ
The questions evaluators ask in the first call — also exposed as structured data for AI search.
Observability Unified is an open-source observability platform for humans and AI agents debugging software. A single collector ingests traces, logs, AI calls, frontend events, session replays, alerts, profiles, analyses, and Agent Action Graph records. The dashboard helps engineers debug AI agents and production systems; the MCP server gives AI agents access to the same evidence graph with compact evidence bundles, stable IDs, confidence, citations, retrieval refs, and next pivots. The fastest first run is one local Docker image with Postgres, the collector, dashboard, blob storage, and seed data.
The Agent Action Graph shows what an agent did and what each step caused. It links browser actions, agent runs, LLM calls, retrievals, tool calls, guardrails, backend traces, logs, profiles, and eval cases through stable action IDs. Engineers see it in the dashboard; AI agents can traverse the same graph through MCP.
Both. Observability Unified debugs AI agents by showing LLM calls, retrievals, tool calls, agent runs, evals, costs, latency, and failures in an Agent Action Graph. It also helps AI agents debug software by exposing MCP tools for traces, logs, service maps, users, replays, connected signals, agent runs, actions, and tool calls.
Yes. The Observability Unified MCP server exposes tools for status, traces, logs, service maps, AI sessions, users, replays, connected signals, profiles, evals, agent runs, actions, tool calls, evidence bundles, retrieval refs, and evidence expansion stats. Agents can start from a failing trace, AI cost spike, user session, profile frame, analysis result, or action ID and gather the same evidence an engineer sees in the dashboard.
CCR means compressed context retrieval. Instead of sending an agent every correlated log, span, replay chunk, profile frame, AI call, and tool payload immediately, Observability Unified returns a compact evidence bundle first: clustered log exemplars, ranked spans, citations, compaction provenance, suggested pivots, and retrieval refs. The raw evidence remains available, but the agent has to expand it intentionally.
Its primary difference is unification for debugging. APM traces, logs, product analytics, session replay, AI observability, alerting, profiles, agent action graphs, and analyses live in one collector and one dashboard, correlated through a single identity chain and exposed to agents through MCP. Instead of leaving agents to scrape dashboards or prose, the platform returns compact evidence bundles, concrete evidence references, confidence, exemplar pivots, retrieval refs, and connected signals. It also runs on your own infrastructure, so no external telemetry vendor sits in the data path.
Retention is controlled by the RETENTION_HOURS environment variable on the collector and defaults to 72 hours. Profile blobs have a separate PROFILE_RETENTION_HOURS override because they're larger per record. Because everything lives in your storage account, you set the policy and pay the storage directly; there's no per-event retention tier to negotiate.
D1 is the default low-ops hosted path for small and medium deployments. The practical ceiling depends on event volume, cardinality, and retention, so heavy installs should move to the Node collector with Postgres plus S3-compatible blob storage before D1 becomes the bottleneck.
Self-hosting is the headline answer: data never leaves your infrastructure, so residency and processor questions reduce to where you deploy. On top of that, the usage-event pipeline applies default-redact scrubbing on ingest; fields named like email, token, password, authorization, or cookie are stripped from context and properties JSON before storage. Session replays use rrweb, which masks input fields by default and supports per-element block/mask attributes.
Not today. Two auth boundaries ship: a write-only ingest API key for SDKs and a single password for the dashboard. Multi-user, RBAC, and SSO are out of scope and tracked separately. Most teams put the dashboard behind their existing identity proxy, such as Cloudflare Access or Tailscale, in the meantime.
Sentry, PostHog, Honeycomb, and older @obs/* package migrations are covered in the docs. For Datadog, OTLP-native ingest accepts the standard OpenTelemetry SDK over OTLP HTTP, so traces and logs are usually a configuration change; a dedicated walkthrough is tracked separately.
Yes. The collector accepts OTLP over HTTP using JSON or protobuf, with gzip. gRPC is intentionally not supported because Cloudflare Workers cannot host it, and OTLP HTTP covers every official SDK. The first-party SDKs are thin wrappers that point the standard OpenTelemetry SDK at the collector and add OpenInference helpers for LLM and tool spans.
Yes. Observability Unified is MIT-licensed. You pay only for the infrastructure you run it on. For production, choose either Cloudflare Workers with D1/R2, or the Node collector on AWS, GCP, Azure, Fly.io, Render, Kubernetes, or any cloud that can provide Postgres and S3-compatible object storage.