Production debugging for engineers and AI agents

Give AI agents the context to debug production software.

AI agents query relevant evidence through MCP. Engineers inspect the same records in the dashboard. Observability Unified connects traces, logs, replay, profiles, and agent activity into one evidence graph. Evidence bundles give agents citations and references to expand as needed.

SDKs + MCP TypeScript · Go · Rust · browser · agents SDK docs
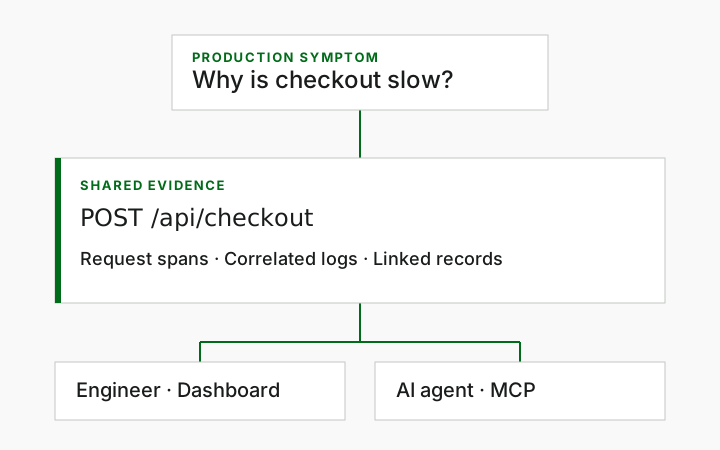
Illustration of a slow checkout leading to shared evidence in the dashboard and MCP
One incident, shared evidence

An engineer opens the request in the dashboard. An AI agent queries the same trace and related records through MCP.

Evidence retrieval · CCR

Give the agent investigation-ready context, not a telemetry dump.

CCR means compressed context retrieval: the collector clusters repetitive logs, selects exemplars, ranks failed spans and critical paths, correlates traces/actions/profiles/replay, and hands the agent explicit retrieval refs for deeper inspection. The agent still controls expansion; the platform just makes the first packet useful.

Before CCR

Raw-tool debugging makes the agent ask for everything.

Without CCR, an agent tends to page through broad logs, full traces, profile metadata, replay metadata, and action records separately. Repeated messages like hundreds of identical 404s consume context even though one exemplar plus count is enough to start.

search_logs({ traceId, limit: 500 })
get_trace(traceId)
get_action(actionId)
get_profile(profileId)
get_replay(sessionId)
After CCR

Evidence bundles summarize first, expand second.

With CCR, the agent asks for one compact bundle anchored on a trace, action, agent run, or tool call. The response includes summaries, evidence refs, compaction records, suggested pivots, and retrieval refs for raw data that remains available but explicit.

get_evidence_bundle({ anchor, targetTokens })
retrieve_evidence_ref(refId)
search_evidence_ref(refId, "checkout 404")
get_evidence_stats()

Benchmark recipe

Benchmark by running the same incident twice: CCR off, then CCR on.

Use fixed anchors, the same agent prompt, and the same token budget. In the off run, let the agent use raw tools such as log search and trace detail. In the on run, start with get_evidence_bundle and only expand retrieval refs the agent chooses. Compare token input, tool calls, raw rows read, cited evidence, and whether the same root cause is reached.

Run it locally pnpm benchmark:ccr Read the benchmark methodology and raw output

Repeated 404 burst

CCR off
Search logs around the failing trace and return the broad result window.
CCR on
Cluster matching log signatures, include exemplars, and attach a logs retrieval ref.
Measure
Raw log rows read vs. exemplar count, prompt tokens, and whether the answer cites the trace and exemplar log.

Slow checkout trace

CCR off
Load the full span tree, then ask the model to infer the critical path.
CCR on
Return failed spans, critical path summaries, and connected profile refs up front.
Measure
Spans included in context, top latency span agreement, and profile ref expansion rate.

Agent tool regression

CCR off
Fetch agent runs, actions, tool calls, eval rows, AI calls, traces, and logs separately.
CCR on
Anchor on the agent run or tool call and return causal path, side-effecting tool refs, failed evals, and connected traces.
Measure
Tool calls made by the debugging agent, correct failed tool/eval identification, and evidence citations.

Replay/profile deep dive

CCR off
Include replay/profile metadata early even when the agent may not need it.
CCR on
Expose replay event-window and profile-frame refs but require explicit expansion.
Measure
How often agents expand deep refs, payload bytes read, and whether unnecessary raw replay/profile data stays out of context.

Executed benchmark

Measured CCR run: 500 repeated 404 logs collapsed to 3 exemplars.

Local benchmark run on June 4, 2026 against the shipped evidence retrieval route. This uses a separate failure fixture, not the slow-checkout proof: a checkout trace with a failed payment span and 500 correlated 404 log rows. CCR preserved the failed payment span reference while reducing the first context packet.

JSON bytes
202,406 5,274
Estimated tokens
50,602 1,319
Log rows in first packet
500 3 exemplars
Reduction
baseline 97.4%

Product proof

See where a slow checkout spent its time.

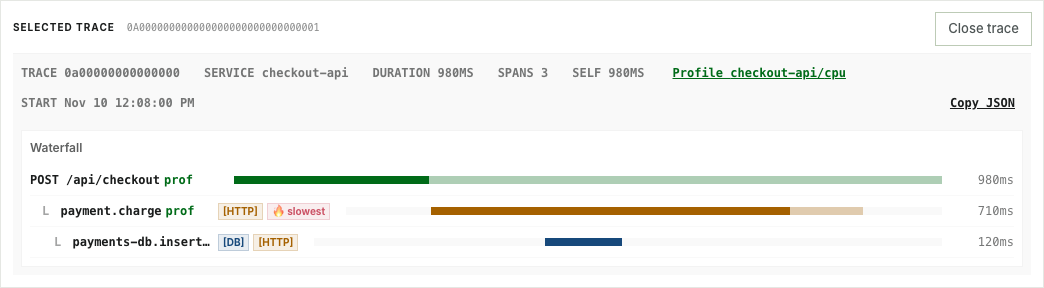
In a seeded demo, an AI agent found a 980 ms checkout request through MCP. The payment call spans 710 ms, about 72% of the request. The agent's evidence bundle also cites a correlated warning log about a 2.4 MB provider response and a CPU profile indexed to the trace, where most sampled payment CPU sits in JSON.parse. An engineer can open the same trace, log, and profile in the dashboard.

Dashboard waterfall for the seeded checkout showing a 980 ms request, a 710 ms payment call, and a nested 120 ms database span
Seeded checkout trace

The dashboard and MCP return the same trace, span, log, and profile IDs. The waterfall shows where the time went. The log and profile support parsing a large provider response as the leading explanation in this synthetic fixture.

Other views, from separate demo data

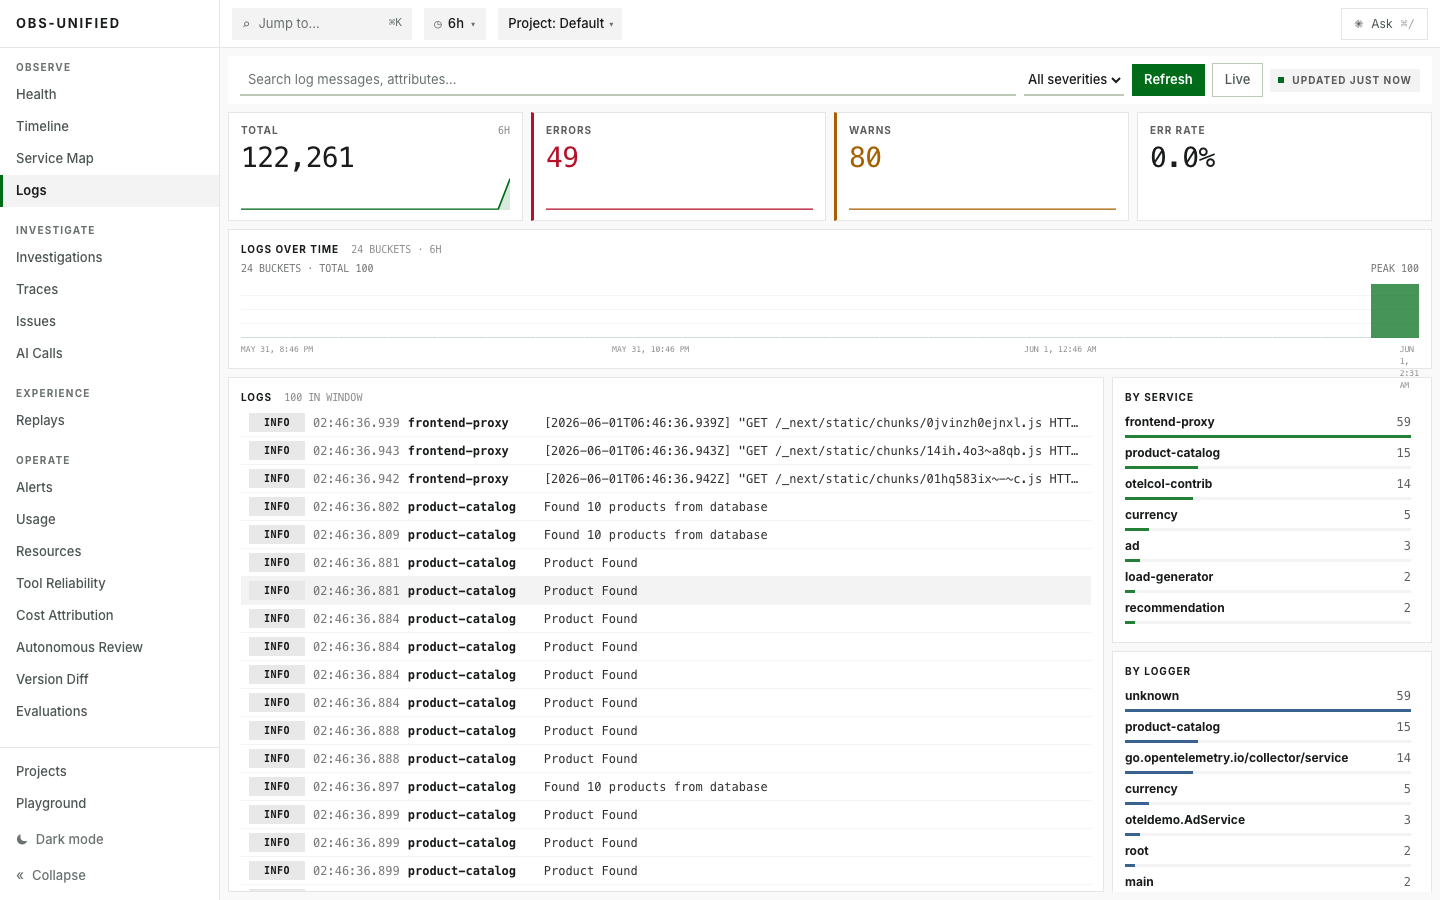
Structured logs in the Observability Unified dashboard
Structured logs

Filter collected logs by service and severity while investigating an incident.

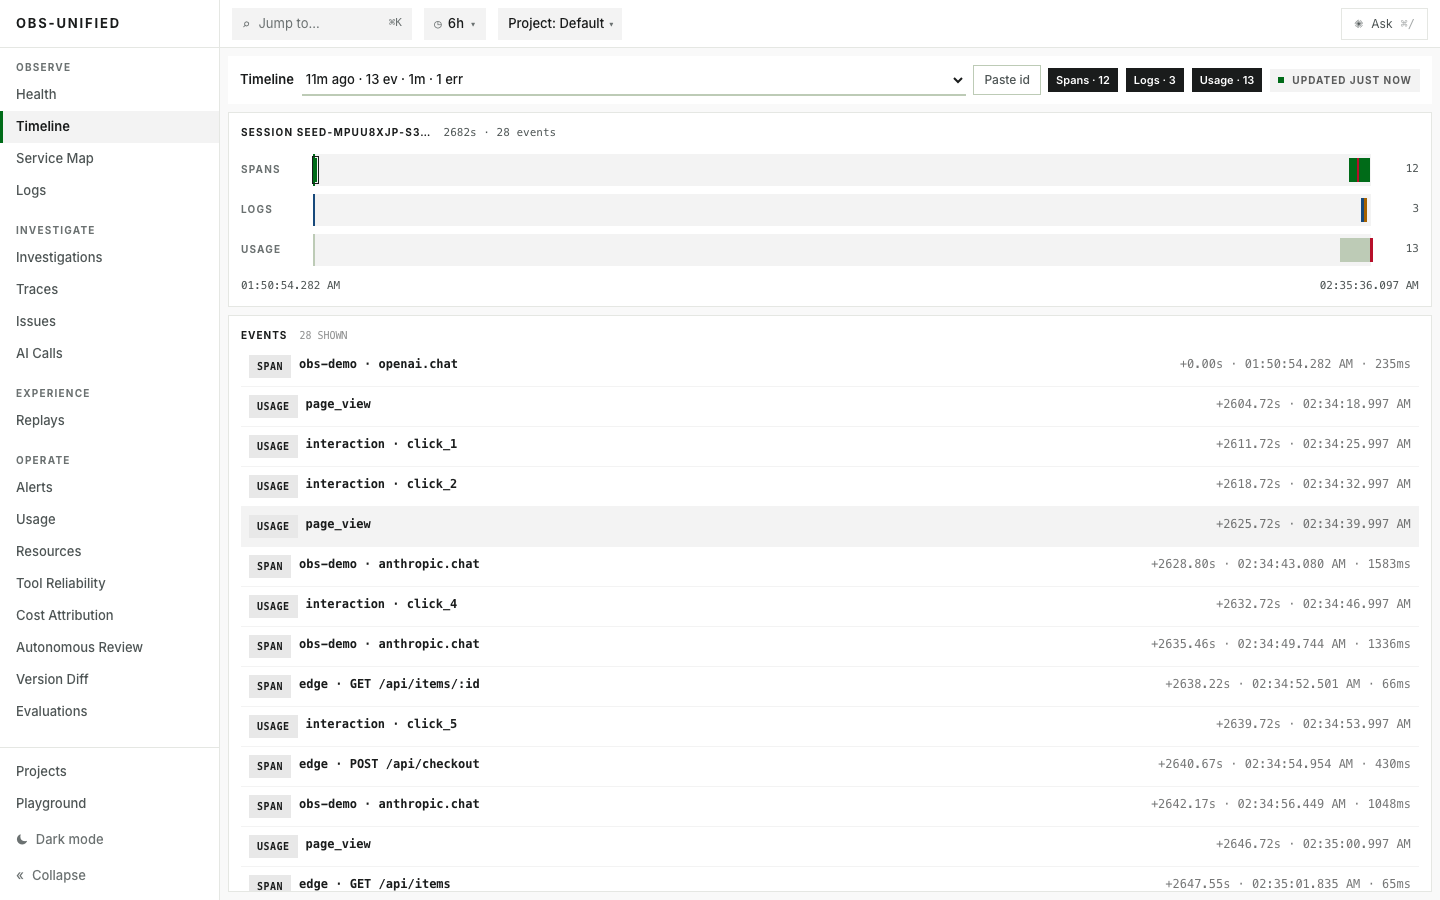
Unified timeline in the Observability Unified dashboard
Unified timeline

User, trace, log, replay, and usage events from one seeded session on a shared timeline.

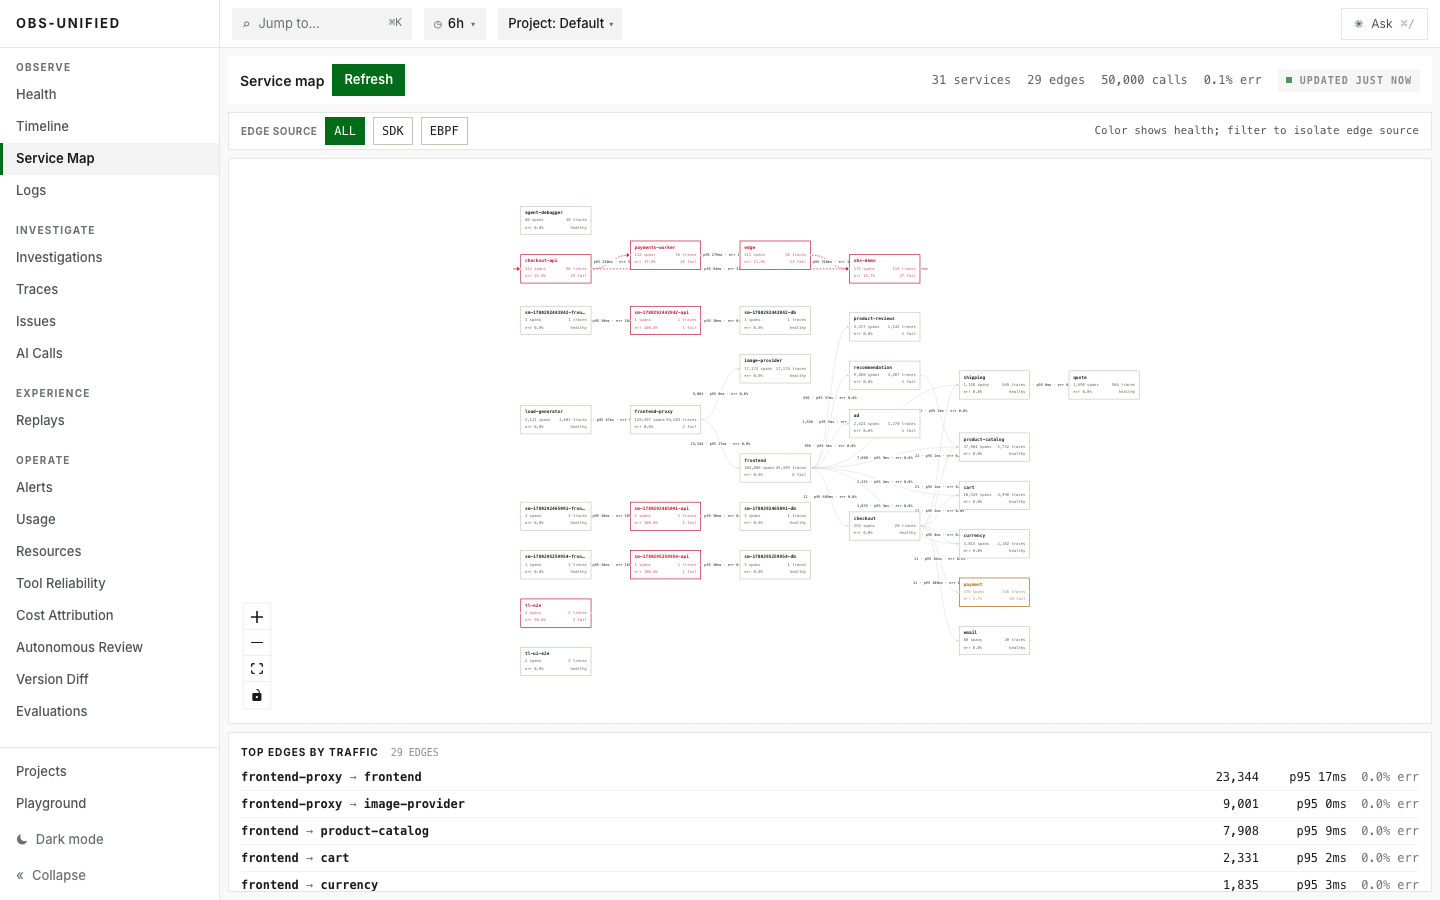
Astronomy Shop service map in the Observability Unified dashboard
Astronomy Shop service map

Service dependencies, edge volume, latency, and errors from the OpenTelemetry demo.

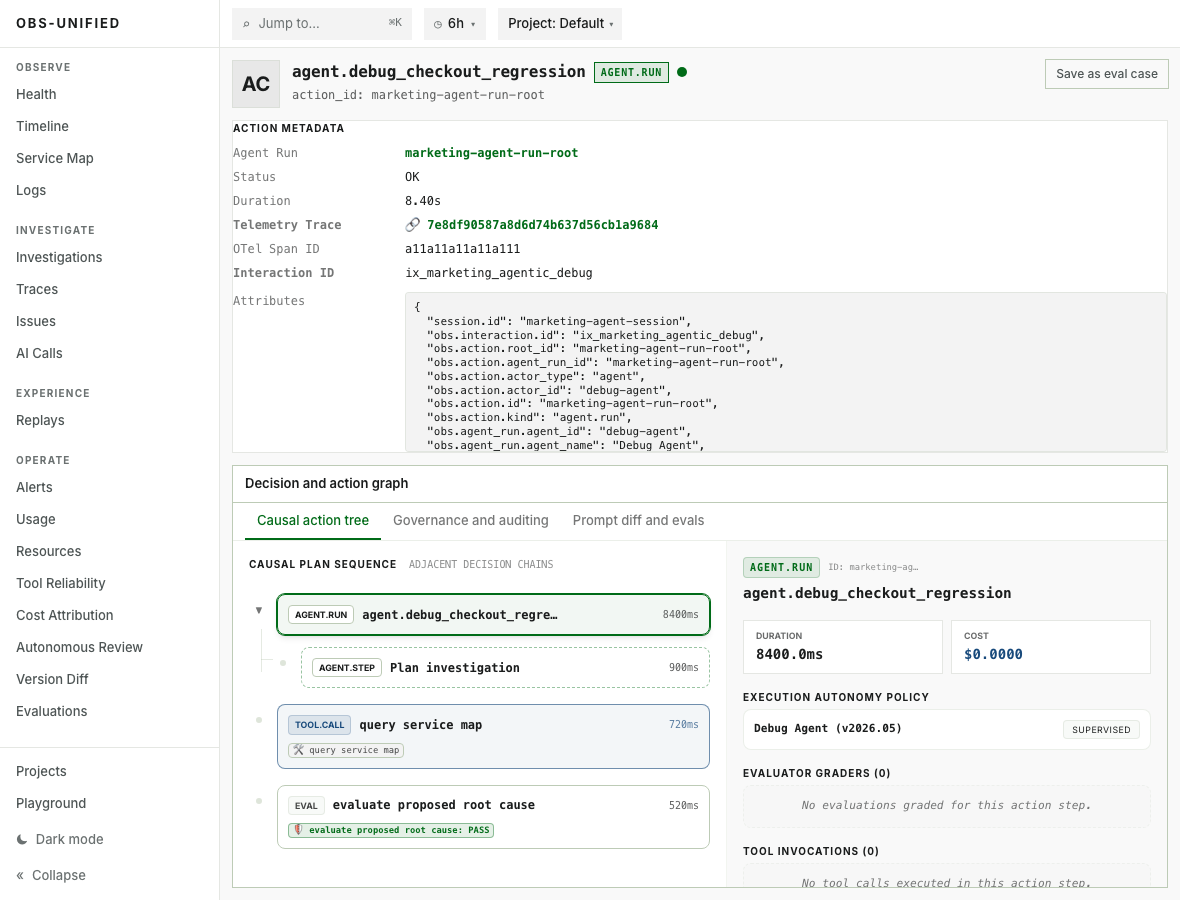
Agent Action Graph in the Observability Unified dashboard
Agent Action Graph

For AI applications: an agent run, its tool calls, evals, trace ID, and interaction ID in one causal view.

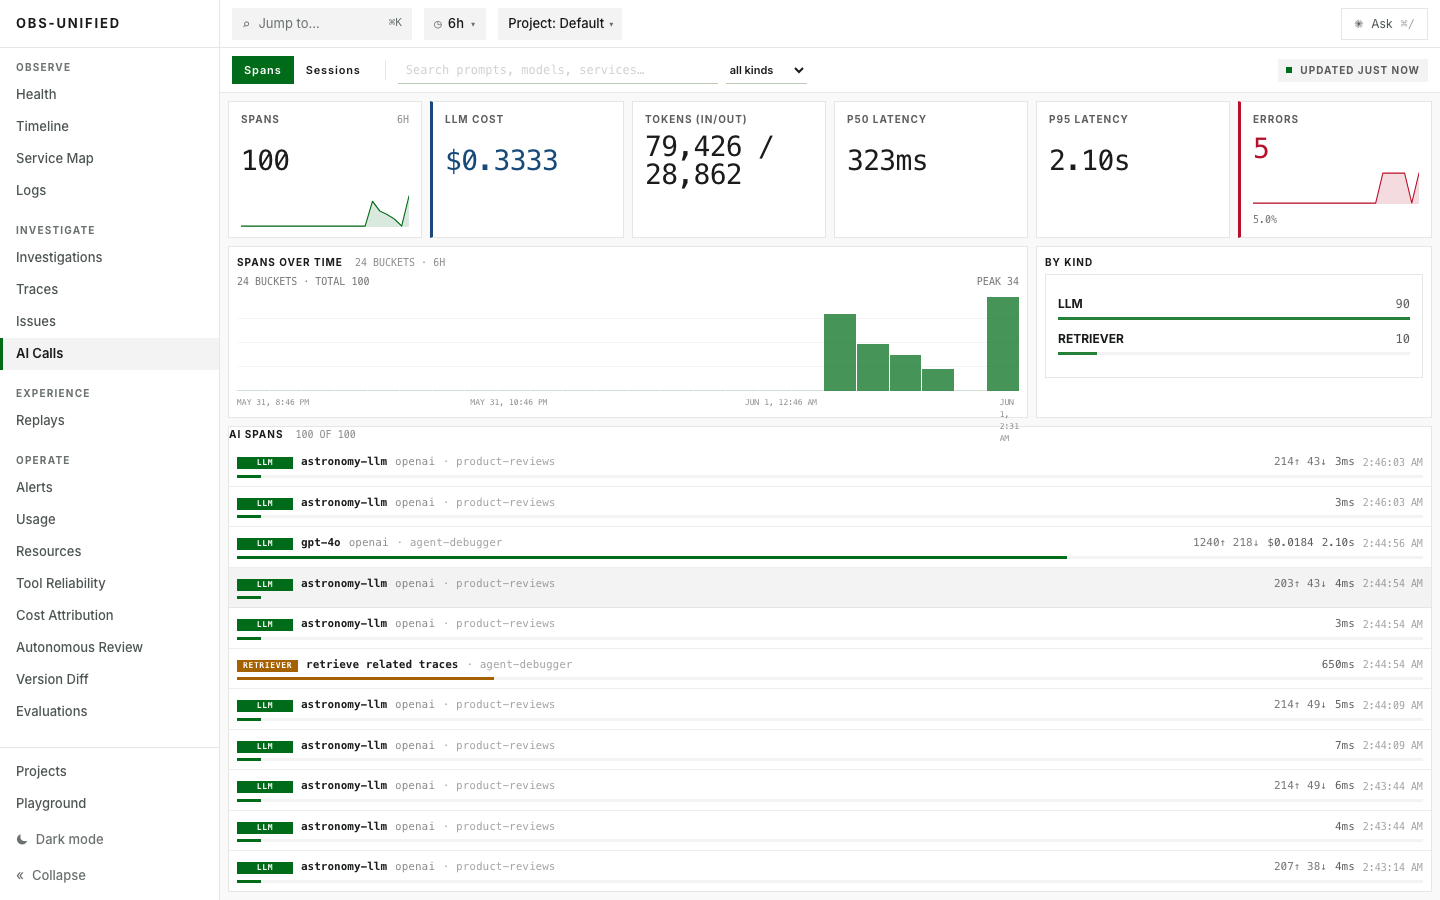
AI cost and LLM spans in the Observability Unified dashboard
AI cost and LLM spans

For AI applications: model, token, cost, latency, and error signals stay queryable together.

One collector · one identity chain · dashboard + MCP

Connect the signals behind an incident.

One collector connects traces, logs, product analytics, session replay, LLM observability, and alerts. Engineers follow those links in the dashboard. AI agents can query the same records through evidence bundles, structured references, and MCP tools.

Identity propagated end-to-end: user_id → session_id → interaction_id → trace_id → span_id → action_id With interaction IDs propagated, a click can lead to backend spans and related records. CPU profiles join when they are indexed by trace ID.

Shipped

Distributed tracing

OTLP-native ingest. Spans, baggage, and propagation work with first-party Node, Go, and Rust SDKs — and any OpenTelemetry SDK over OTLP.

Shipped

Structured logs

JSON logs with severity, automatic trace correlation, and per-module loggers. Auto-attached to the active span — no copy-paste IDs.

Shipped

Agent-readable evidence

Evidence bundles compact repeated logs, rank spans, preserve citations, and return retrieval refs so agents can expand raw logs, profiles, replay, AI calls, or tool calls on demand.

Shipped

SDKs and MCP server

First-party SDKs for TypeScript, Go, and Rust plus an MCP server that lets agents inspect traces, logs, replays, profiles, agent runs, actions, tools, changes, and evals.

Shipped

Interaction ID to CPU

A click mints one interaction_id. Backend spans, logs, AI calls, and action graphs join through the resulting trace. CPU profiles join too when profiling is enabled and samples are indexed by trace ID.

Shipped

Session replay

Browser sessions recorded with rrweb, stored as DOM-mutation chunks in R2, and replayed inline next to the trace they belong to.

Shipped

Usage analytics

Page views, interactions, errors, UTM parameters, and identity stitching — the product-analytics layer, in the same store as your traces.

Shipped

AI and agent actions

LLM calls, retrievals, tool calls, agent runs, eval cases, tokens, USD cost, latency, and failure category — all linked into one causal action graph.

Shipped

Alerts

Alert rules over any signal — latency, error rate, AI spend, custom usage events. One rules engine and one notification surface across the stack.

Shipped

User profiles

Identity linking from anonymous visitor to logged-in user, with traits and event history. Every signal can be filtered by user and replayed from their perspective.

Shipped

AutoSRE & change correlation

Correlate deploys, feature flags, and config changes with traffic-normalized cohort error lift and noisy-neighbor contention checks. Remediation is policy-gated: MCP write tools are opt-in, and your own runner executes any approved change.

Quick preview

From zero to correlated signals in three steps

Start the local stack, pick SDKs for your runtime, and initialize each service. With identity propagation in place, frontend interactions and backend spans can be investigated together. After telemetry arrives, see how an agent retrieves related evidence.

1 Run the local stack

Pull the prebuilt image from GHCR, or build the seeded local image. Details in Installation.

bash
# Run the prebuilt all-in-one image (with seeded sample data)
export INGEST_KEY="pick-a-long-random-ingest-key"
export DASHBOARD_PASSWORD="pick-a-dashboard-password"
export DASHBOARD_TOKEN="pick-a-read-token-for-mcp-and-cli"
docker run --rm -p 5173:5173 -p 8790:8790 \
  -e INGEST_KEY -e DASHBOARD_PASSWORD -e DASHBOARD_TOKEN -e OBS_LOCAL_SEED=true \
  ghcr.io/dev-sawan-ruparel/obs-unified:latest

# Or scaffold a new pre-wired app non-interactively
pnpm dlx @obsunified/cli create my-app --template react-vite --collector-url http://localhost:8790 --yes
2 Pick SDKs

Runnable examples and recipes live in Examples and SDK docs

text
Backend:
  TypeScript  pnpm add @obsunified/telemetry-sdk
  Go          go get github.com/dev-sawan-ruparel/obs-unified/sdks/go
  Rust        cargo add obs-unified

Browser:
  React/vanilla  pnpm add @obsunified/analytics-sdk
3 Instrument backend and frontend

Short path shown. Full TypeScript, Go, and Rust examples live in Getting started.

typescript
// Backend
initObservability({
  serviceName: "checkout-api",
  environment: "prod",
  serviceVersion: "2.4.1",
});
recordFeatureFlag("enable_legacy_tax_fallback", false);
const log = createLogger("checkout");
const llm = startLLMSpan("checkout.assistant");
log.info("charge.starting", { interaction_id });
llm.end();

// Frontend
trackInteraction("checkout_click");

Architecture

One collector. Your telemetry graph.

Instrumented services write telemetry into Observability Unified. Humans and agents read the same connected graph through dashboard APIs, compact evidence bundles, structured evidence references, and MCP tools, while ingest credentials stay separate from investigation access.

Instrumented systems
Frontend app

interactions, replay, errors

Backend services

traces, logs, profiles

Workers

edge requests, jobs

AI / LLM calls

agent runs, tokens, cost, tools

Write boundary SDKs + OTLP ingest

Write-only keys send telemetry without read access.

Observability Unified
Collector

Normalizes every signal into one identity chain.

Owned storage

D1/R2 or Postgres/S3

Connected graph

evidence IDs, compact bundles, traces, logs, replay, AI cost, actions, CPU

Read boundary Dashboard + APIs + MCP

Agents inspect telemetry with MCP investigation tools.

Investigation clients
Dashboard users

inspect sessions, traces, logs, replay, alerts, costs

Debugging agents

follow compact bundles, refs, confidence, and pivots

Incident workflows

follow evidence from action to root cause

How it compares — source-checked 2026-10-13 against vendor pages; agent-access row 2026-11-10; agent-evidence rows 2026-11-11

Compare investigation workflows

When an incident spans several signals, engineers and agents need to find related evidence. Observability Unified connects instrumented signals through shared IDs, gives agents compact evidence bundles through MCP, and lets engineers inspect the same records in the dashboard. The table compares signal coverage, AI agent access and evidence, and deployment options.

Capability Observability UnifiedDatadog[src]Sentry[src]PostHog[src]Honeycomb[src]New Relic[src]Grafana Cloud[src]SigNoz[src]Uptrace[src]HyperDX[src]
Hosting model Self-host on your infra SaaS · BYOC for logs SaaS or Fair Source self-host Cloud-first · hobby self-host SaaS · Private Cloud (AWS) SaaS (US · EU · JP) Cloud or self-host OSS LGTM Cloud · BYOC · OSS self-host Cloud · OSS (AGPL) · on-prem Cloud · OSS (MIT) · ClickStack
Pricing model Self-hosted · your infrastructure Per host + per signal Tier + per-unit overage Per-unit, per product Per event volume $/GB + per-user (or Compute) $19/mo + per series + $/GB $49/mo min · $0.30/GB Per GB ingested · tiers · 50 GB free $20 flat + $0.40/GB
Traces / APM OTLP-native (HTTP) Yes · OTLP (Agent or direct) Tracing · OTLP beta OTLP tracing (beta, Jul 2026) OTLP-native Native OTLP Tempo · OTLP OTLP-native OTLP-native (gRPC + HTTP) OTLP-native (gRPC + HTTP)
Structured logs Trace-correlated Yes Yes · trace-connected Yes · OTLP (GA Jan 2026) Log Analytics · event model Yes · server-side parsing Loki Yes · Logs Explorer Yes Yes · ClickHouse-backed
AI / LLM observability Built-in · Action Graph · CCR Agent Observability Agent Tracing · Seer AI Observability Agent Timeline (GA Jun 2026) AI Monitoring Agent Observability (GA Jul 2026) LLM Observability OTel GenAI instrumentation guides Via OTel LLM SDKs
Session replay rrweb Yes (RUM) Yes (web + mobile) rrweb Not marketed† Yes · DOM-based Public preview add-on Not marketed† Not marketed† Yes · auto-linked
Product analytics Usage analytics Yes Not marketed† Flagship Not marketed† Browser journeys · NRQL funnels Not marketed† Not marketed† Not marketed† Not marketed†
Alerts Built-in · incident dedup 30+ types · Watchdog Issues · uptime · crons Insights + logs Triggers · BubbleUp NRQL conditions Grafana Alerting 5 alert types Metric + error monitors Search-based
Cross-signal pivots Connected Rail · AutoSRE ontology · MCP Within platform · tags Within platform · trace ID One project / event store One event store Via NRQL Per-data-source links Trace ↔ logs One store Auto-linked across signals
AI agent access (MCP) Stdio MCP · read-only default · citations Remote MCP · writes need permissions Hosted MCP (OAuth) · local via CLI Hosted MCP · read + write tools Hosted MCP · scoped write tools Hosted MCP (US · EU · JP) Hosted Cloud MCP · self-managed OSS Hosted MCP (Cloud) · self-host binary Built-in MCP · read/write scopes ClickStack OSS, BYOC, and managed MCP
Compacted evidence for AI agents CCR bundles · token budget · refs MCP truncation · max_tokens Condensed MCP trace overview MCP log patterns → raw lines MCP summaries + drill-down tools MCP log error patterns MCP Loki patterns MCP aggregates · pagination MCP span and log groups MCP log patterns · trimming
Agent skills for coding agents Instrument + investigate skills Pup CLI · Labs skills (experimental) Claude Code · Cursor · Codex plugins AI plugin · Claude Code · Cursor · Codex Agent Skills plugin Claude Code plugin · skills hub grafana/skills Agent Skills plugin Skill guides via MCP resources ClickStack collector skill
One ID chain from user to agent action user → session → trace → agent action RUM ↔ APM ↔ Agent Observability Replay ↔ trace ↔ agent conversation Session · person · spans · LLM (beta) Browser ↔ backend · GenAI spans Browser ↔ backend · AI trace view Session ↔ trace · AI traces Browser ↔ backend · LLM spans LLM spans in app trace · user ID Replay ↔ trace · LLM by user (beta)
Points out gaps in your instrumentation Self-time gap flags · get_trace Tag rules for required tags Orphan + no-instrumentation spans Via agent skill · ingestion warnings Waterfall flags absent spans Orphaned-span markers Uninstrumented services Spans with uncollected parents Not marketed† Instrument-with-AI prompt
Data ownership Your D1/R2 or Postgres/S3 Datadog site · BYOC logs Sentry cloud or yours PostHog cloud or yours Honeycomb US/EU or your AWS New Relic US/EU/JP Grafana cloud or yours US/EU/India · BYOC · yours Cloud (Germany) or yours Cloud (US) or yours

Beyond the 15 axes above — what AutoSRE & agentic onboarding add: When an AI agent investigates an incident across fragmented tools, it often confuses traffic share with deploy regressions, blames application code during shared-DB noisy-neighbor saturation, or proposes unsafe rollbacks from stack-trace coincidence alone. Observability Unified separates relationshipCertainty (link provenance) from causalProofTier (causal proof), computes per-request error lift across deploy/flag cohorts (v_new vs v_old), verifies fixes via paired baseline-fail/candidate-pass counterfactual evals, and gates external runners with single-use CAS remediation grants and a 1-click human approval queue — see AutoSRE causal ontology and Where Observability Unified fits.

81 of 90 vendor cells were directly checked against the vendor's own live page on 2026-10-13 and corrected where the source had changed; the 9 cells marked † are inferential (the vendor does not market that capability on the pages we read) and are not claimed as source-checked. The AI agent access (MCP) row was added later: 9 of 9 vendor cells were checked against the vendor's own live page on 2026-11-10 (supplementary ledger). The four agent-evidence rows (Compacted evidence for AI agents, Agent skills for coding agents, One ID chain from user to agent action, Points out gaps in your instrumentation) were added on 2026-11-11: 35 of 36 vendor cells were checked against the vendor's own pages, and 1 is marked † (agent-evidence ledger). Cells are descriptive, not scored. Vendor headers link to the cited sources in the comparison doc; per-cell verdicts and excerpts live in the tracked audit ledger. Pricing changes often; treat prices as of the review date.

FAQ

Operational questions, answered up front

The questions evaluators ask in the first call — also exposed as structured data for AI search.

What is Observability Unified?

Observability Unified is a self-hosted observability platform that gives AI agents context to debug production software. One collector connects traces, logs, replay, profiles, and agent activity. AI agents retrieve compact evidence bundles with citations through MCP, and engineers inspect the same records in the dashboard. A local Docker image includes the collector, dashboard, storage, and optional sample data.

Can agents investigate incidents in applications that do not use AI?

Yes. Agents can use MCP to investigate ordinary production incidents using traces, logs, service maps, replays, and other connected evidence. For applications that use AI agents, the Agent Action Graph also shows runs, model calls, tools, costs, and evals.

Can AI agents inspect Observability Unified through MCP?

Yes. The Observability Unified MCP server exposes tools for status, traces, logs, service maps, AI sessions, users, replays, connected signals, profiles, evals, agent runs, actions, tool calls, evidence bundles, retrieval refs, evidence expansion stats, recent changes, change blast radius, and similar findings. Remediation tools are registered only when writes are explicitly enabled. Agents can start from a failing trace, AI cost spike, user session, profile frame, analysis result, or action ID and gather the same evidence an engineer sees in the dashboard.

What is CCR?

CCR means compressed context retrieval. Instead of sending an agent every correlated log, span, replay chunk, profile frame, AI call, and tool payload immediately, Observability Unified returns a compact evidence bundle first: clustered log exemplars, ranked spans, citations, compaction provenance, suggested pivots, and retrieval refs. The raw evidence remains available, but the agent has to expand it intentionally.

How is it different from Datadog, Sentry, or PostHog?

Its primary difference is unification for debugging. APM traces, logs, product analytics, session replay, AI observability, alerting, profiles, agent action graphs, and analyses live in one collector and one dashboard, correlated through a single identity chain and exposed to agents through MCP. Many observability vendors now offer MCP servers; see the comparison for sourced details. Here, MCP tools are read-only by default and return compact evidence bundles with citations, evidence references, confidence, exemplar pivots, and retrieval refs that link back to the same records the dashboard shows. It also runs on your own infrastructure, so no external telemetry vendor sits in the data path.

What is the Agent Action Graph?

The Agent Action Graph shows what an agent did and what each step caused. It links browser actions, agent runs, LLM calls, retrievals, tool calls, guardrails, backend traces, logs, profiles, and eval cases through stable action IDs. Engineers see it in the dashboard; AI agents can traverse the same graph through MCP.

How does AutoSRE keep an AI agent from rolling back the wrong deploy?

AutoSRE separates link provenance (relationshipCertainty: exact, inferred, heuristic) from causal proof (causalProofTier: unverified_locus, corroborated_candidate, cohort_rate_isolated, counterfactual_verified), and a per-action policy matrix decides what each tier allows. For rollback_deploy and toggle_feature_flag, a stack frame overlapping a changed file only reaches corroborated_candidate, which needs human approval in the dashboard, and unverified_locus is blocked. A grant without human approval needs traffic-normalized cohort error lift (with minimum sample sizes and noisy-neighbor contention checks) or paired baseline-fail/candidate-pass counterfactual eval runs. Config and prompt changes need counterfactual verification. MCP write tools stay unregistered unless you set OBS_MCP_ENABLE_WRITES. The collector only issues a single-use grant; your own runner claims it and executes the change.

What's the data retention model?

Retention is controlled by the RETENTION_HOURS environment variable on the collector and defaults to 72 hours. Profile blobs have a separate PROFILE_RETENTION_HOURS override because they're larger per record. Because everything lives in your storage account, you set the policy and pay the storage directly; there's no per-event retention tier to negotiate.

When do I outgrow D1, and what's the upgrade path?

D1 is the default low-ops hosted path for small and medium deployments. The practical ceiling depends on event volume, cardinality, and retention, so heavy installs should move to the Node collector with Postgres plus S3-compatible blob storage before D1 becomes the bottleneck.

How does it handle PII and GDPR?

Self-hosting is the headline answer: data never leaves your infrastructure, so residency and processor questions reduce to where you deploy. On top of that, the usage-event pipeline applies default-redact scrubbing on ingest; fields named like email, token, password, authorization, or cookie are stripped from context and properties JSON before storage. Session replays use rrweb, which masks input fields by default and supports per-element block/mask attributes.

Does it support SSO or multi-user dashboards?

Not today. Two auth boundaries ship: a write-only ingest API key for SDKs and a single password for the dashboard. Multi-user, RBAC, and SSO are out of scope and tracked separately. Most teams put the dashboard behind their existing identity proxy, such as Cloudflare Access or Tailscale, in the meantime.

Can I migrate from Datadog, Sentry, or PostHog?

Sentry, PostHog, Honeycomb, and older @obs/* package migrations are covered in the docs. For Datadog, OTLP-native ingest accepts the standard OpenTelemetry SDK over OTLP HTTP, so traces and logs are usually a configuration change; a dedicated walkthrough is tracked separately.

Does it work with my existing OpenTelemetry SDK?

Yes. The collector accepts OTLP over HTTP using JSON or protobuf, with gzip. gRPC is intentionally not supported because Cloudflare Workers cannot host it, and OTLP HTTP covers every official SDK. The first-party SDKs are thin wrappers that point the standard OpenTelemetry SDK at the collector and add OpenInference helpers for LLM and tool spans.

Where can I self-host Observability Unified?

Start locally with Docker. For production, choose Cloudflare Workers with D1 and R2, or deploy the Node collector with Postgres and S3-compatible object storage.